Visualizing Traveling Salesman Problem
Traveling Salesman Problem asks the following question: Given a list of cities and distances between them, how do you determine a path that connects all the cities, while minimizing the total distance traveled ?
This is one of the most popular problems in Combinatorial Optimization, and has wide range of applications in trip planning, logistics, and signal routing in micro-electronic fabrication etc.
In this post, we explore how to develop an intuitive understanding of such problems using visualizations. The main content for this post originally developed during a Kaggle Competition in 2018. The Kaggle Notebook has the code for computing the paths visualized in this post, and some earlier versions of these visualizations.
Overview of the Data
In this implementation of the problem, the data was provided as a list of cities with X and Y coordinates. Our goal is to figure out a path for Santa Claus to cover all the cities with minimum distance traveled.
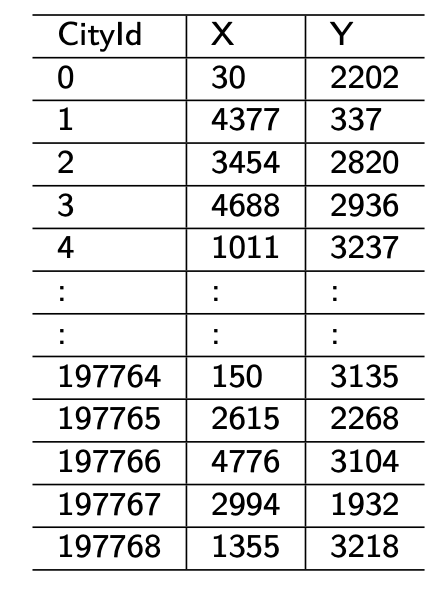
To our delight, the organizers of the problem arranged all the cities in a nice reindeer pattern !
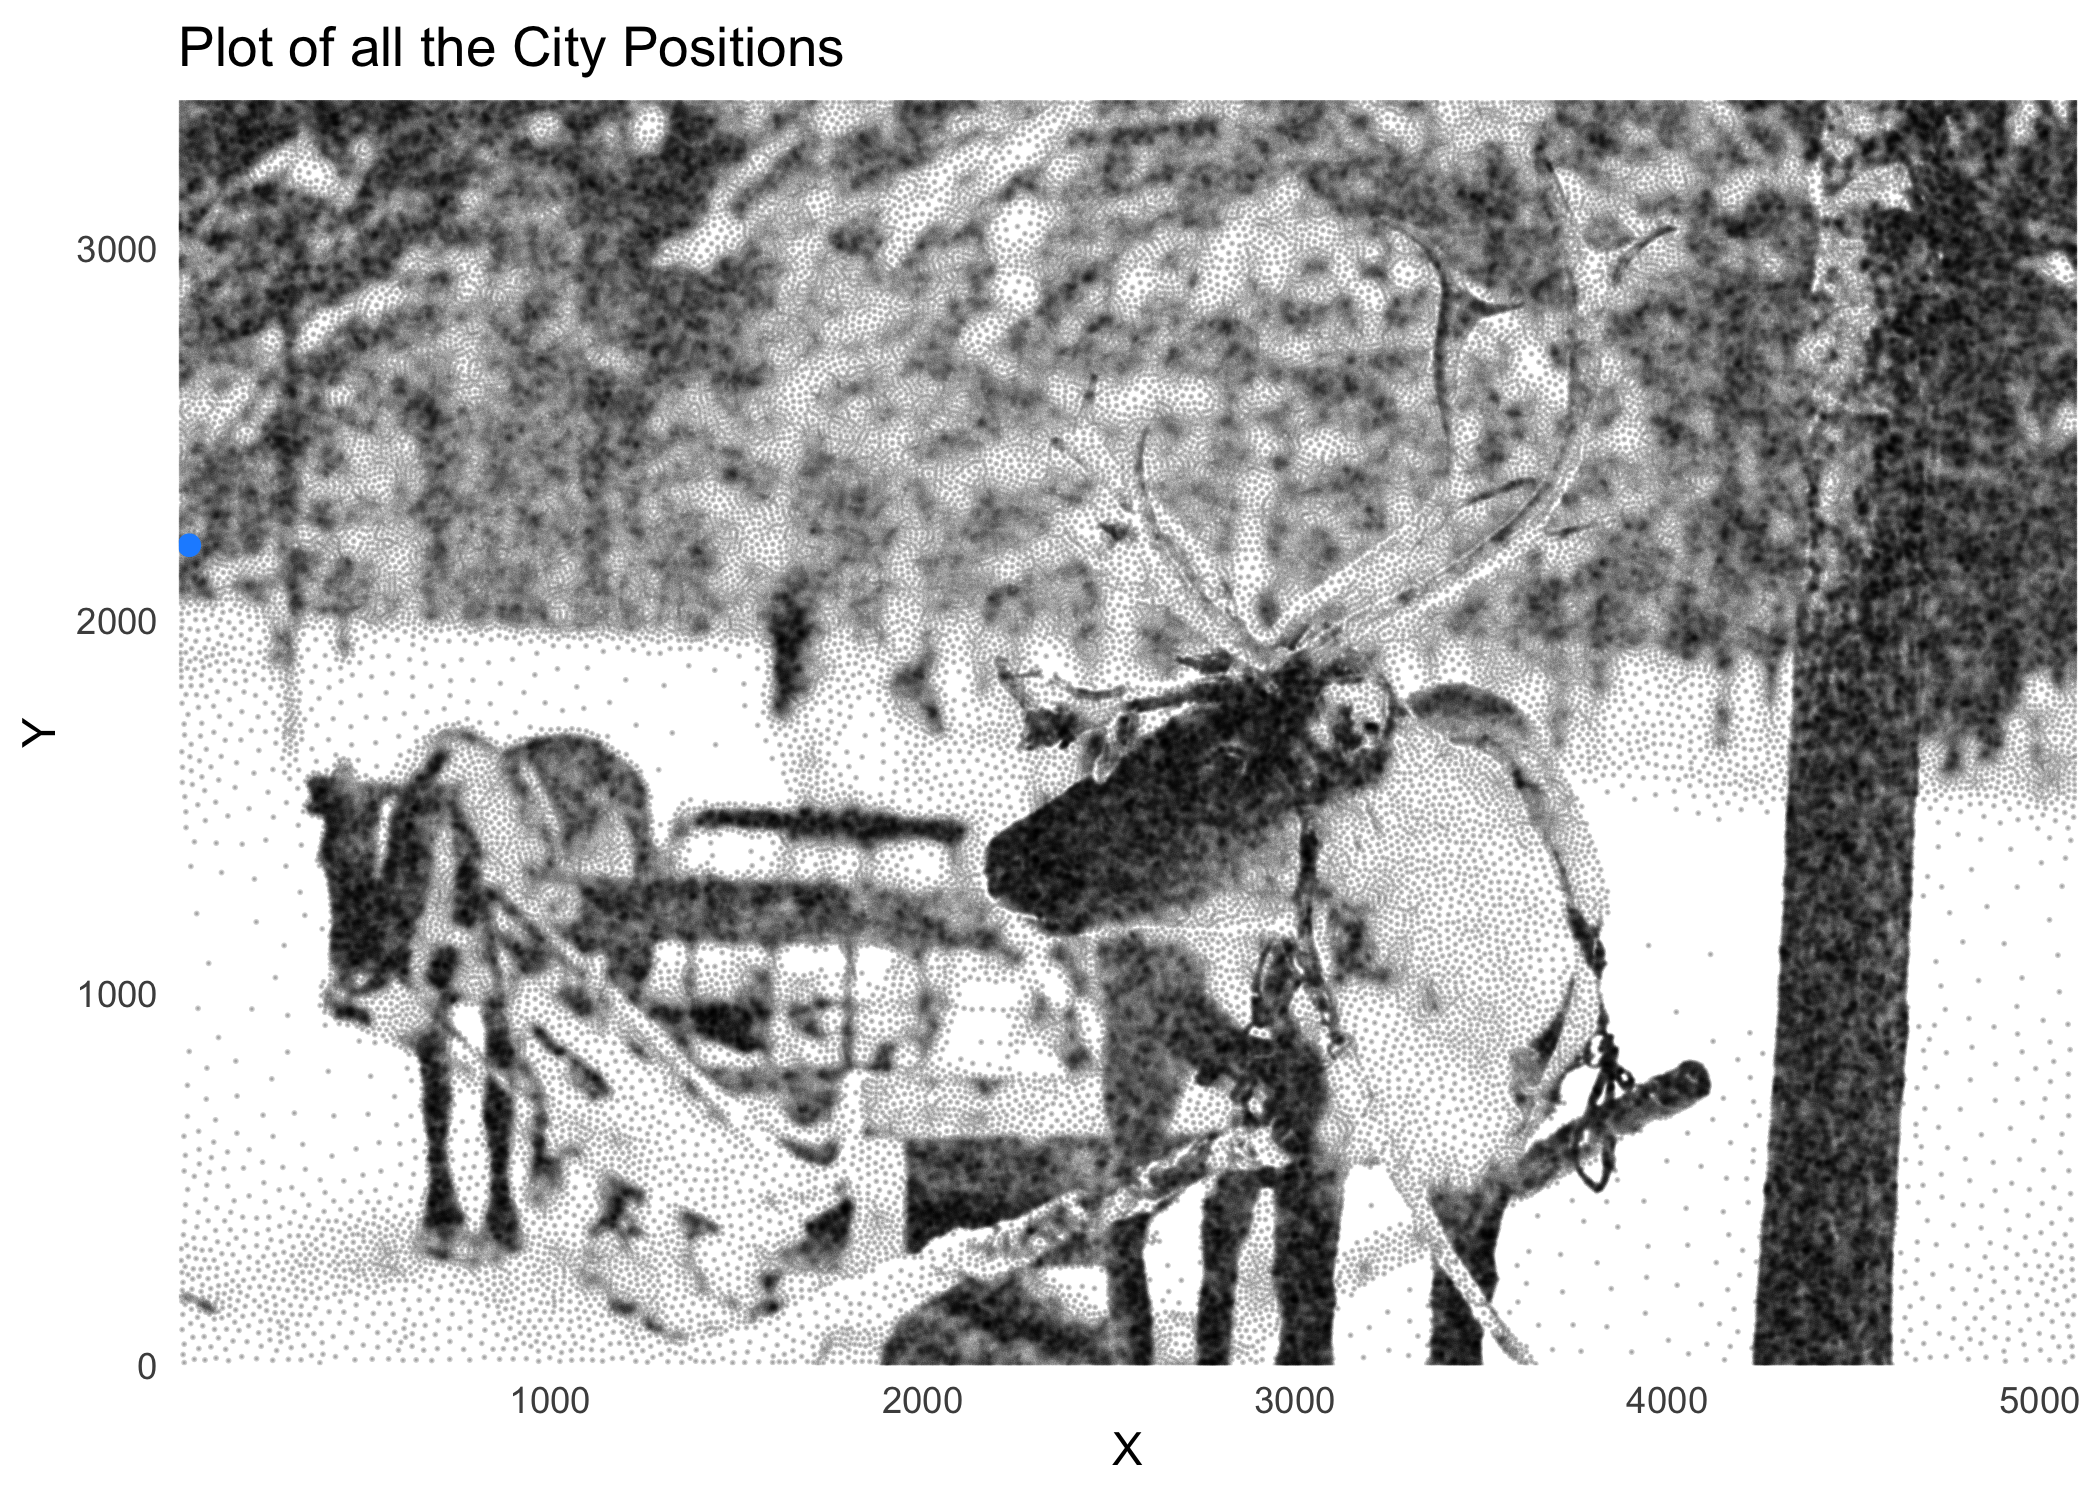
In this problem, all the cities nicely form a reindeer pattern !
Simplest Path: Following the cities in a random order
Our first guess is the simplest path which covers all the cities in the order they are listed. We can see from the picture below that this path is very inefficient. It actually takes about 446 million miles to cover all the cities using this path.
As we can see, the following cities in the order of CityId is very inefficient. Let’s sort them by X and Y, and see if we can get a better path.
Iteration 2: Sorting the cities by X and Y
A Sorted City Path moves in orderly from left to right. There are still many unnecessary up-down trips. Using this path, the total distance traveled is cut in about half as shown later in this post.
Iteration 3 : Sorted cities within a grid of squares
One of the problems we can see with the previous path is that though Santa is moving in a systematic left-to-right fashion, he is moving between the extremes of the Y-axis while doing that.
If we divide the the whole network into a grid of X’s and Y’s, then Santa can cover each square in the grid, before moving on to the next square. It should be more efficient as shown below.
We go one step further, and cover the grid cells in an alternating fashion, so that we go up in one column of the grid, and come down in the next column, to cut-down some more long trips.
With the alternating grid path, we see a substantial reduction in the distance (196 million to 2 million miles) as shown in the figure towards the end.
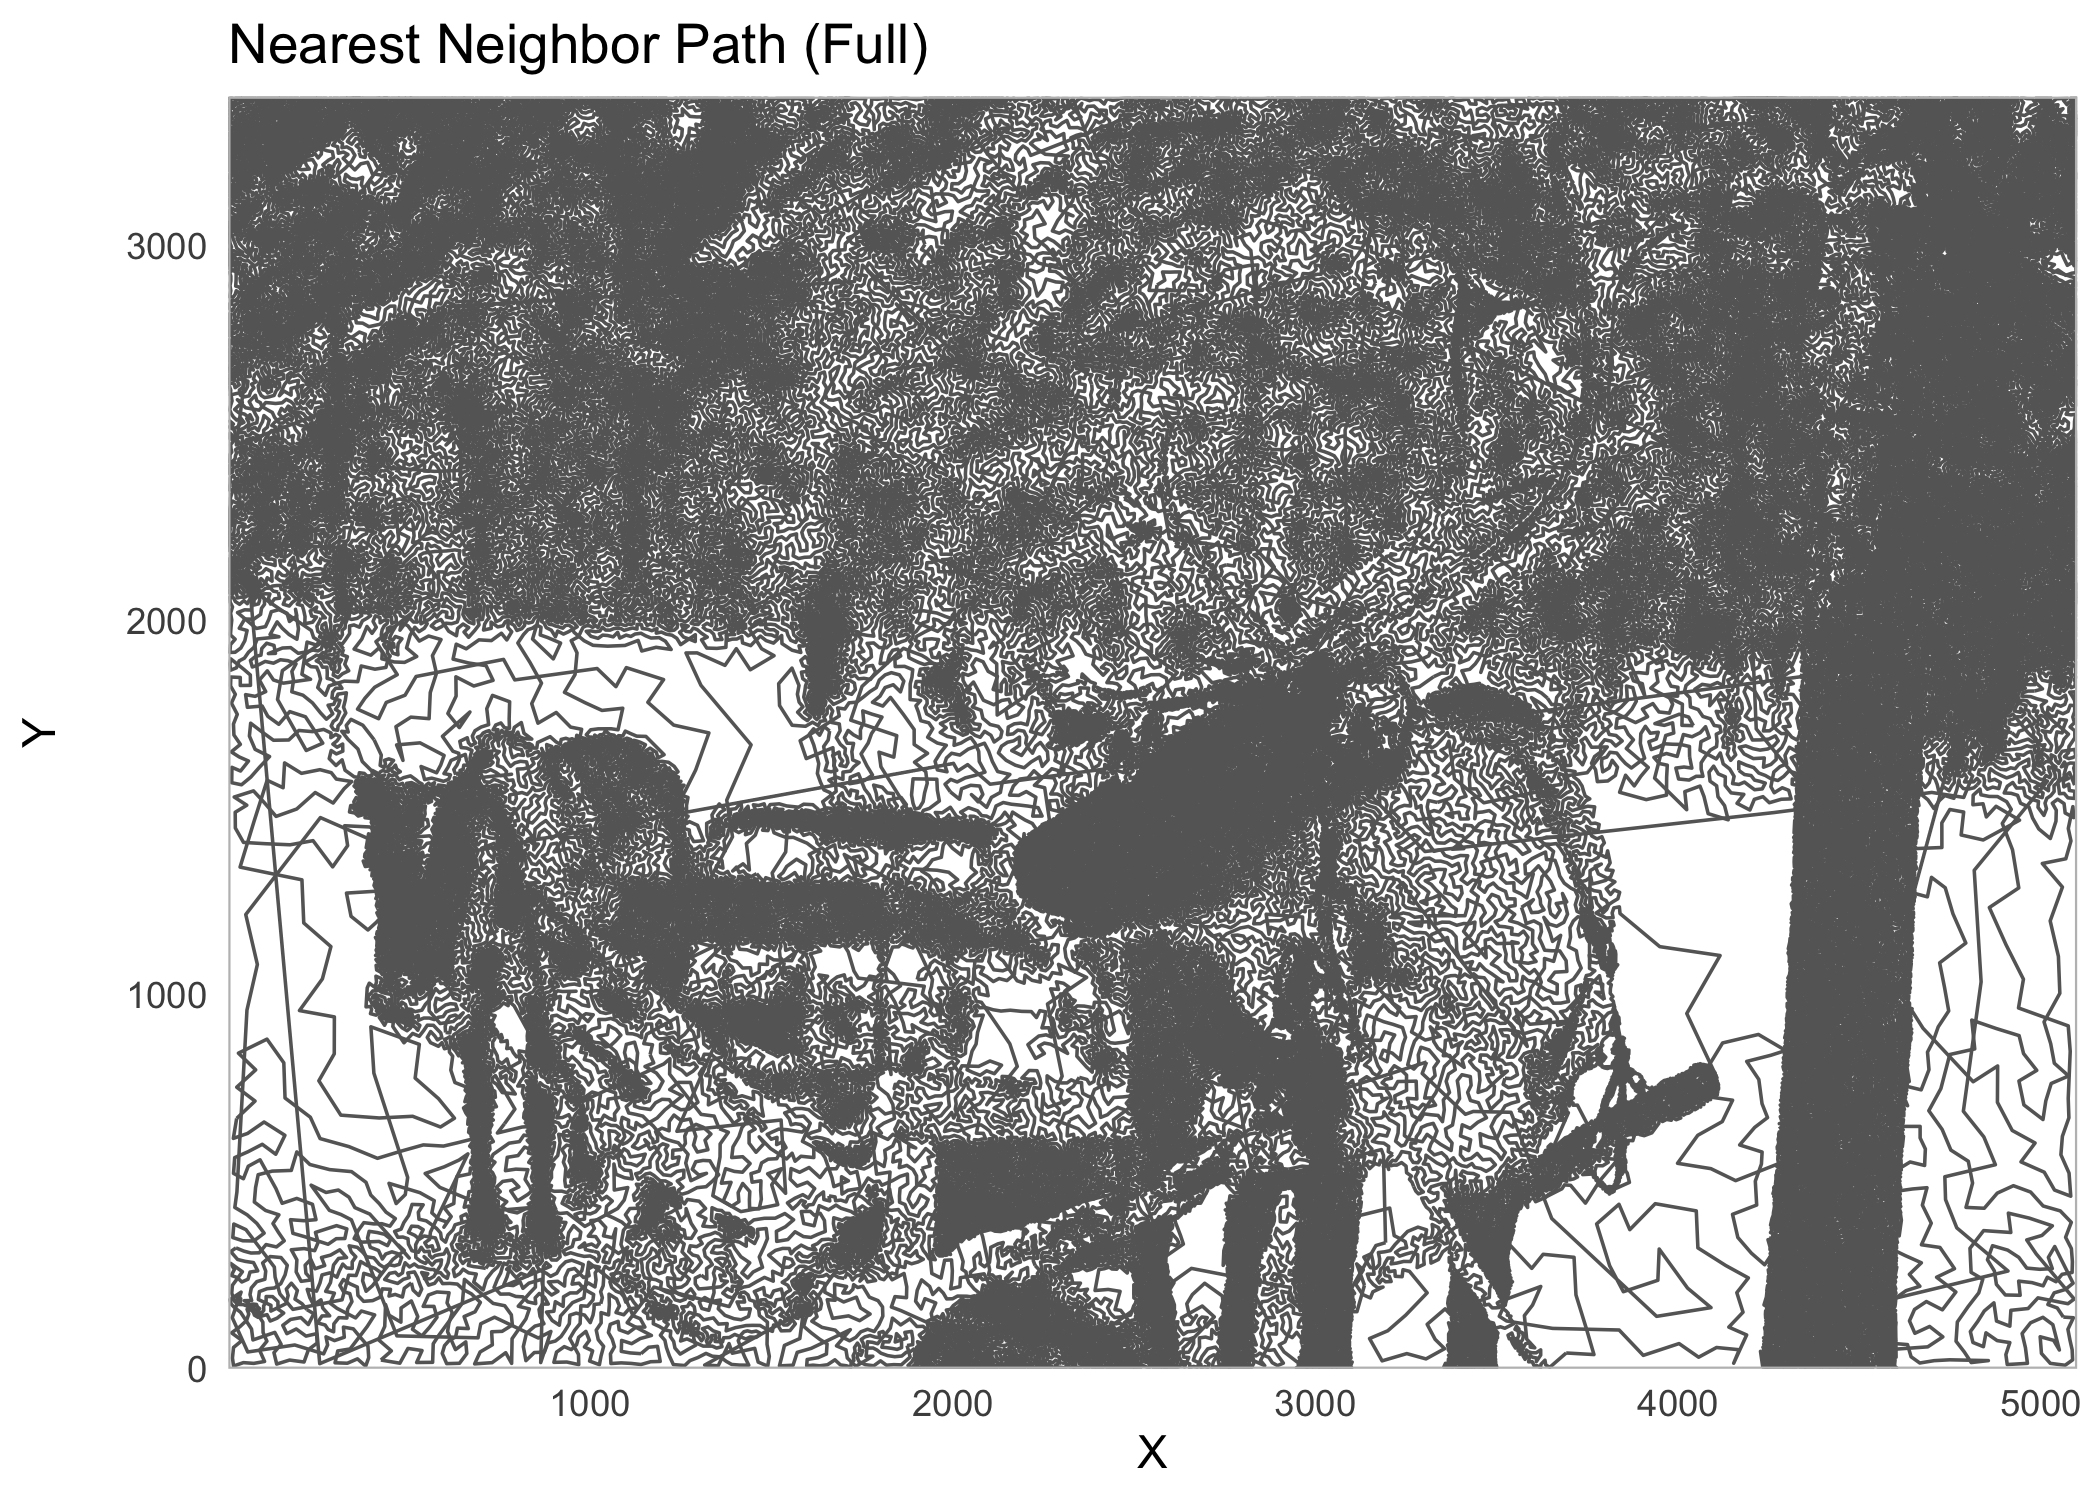
Further improvement: Nearest Neighbor Path
If we look at our approach so far, we have been trying to eliminate any unnecessary long trips and are trying to cover all the near by cities at any time during the travel. A natural extension to this approach would be to use a Nearest Neighbor algorithm, where we try to go from one city to the city nearest to that city and follow this procedure to the end.
The following is an animation of the first few cities in the nearest neighbor path.
When the full nearest neighbor path is implemented, we can see our familiar reindeer pattern as shown below.
Results: Comparison of different paths
As illustrated in the figure below, we can see that we were able to improve the total distance traveled from 447 million miles to 1.8 million miles (alternating grid path), just using an intuitive understanding and visualization of the problem. More advanced heuristics and optimization techniques improve the results further, but not by a lot.
Even the winning solution in the competition was only better by about 16% compared to our nearest neighbor solution.
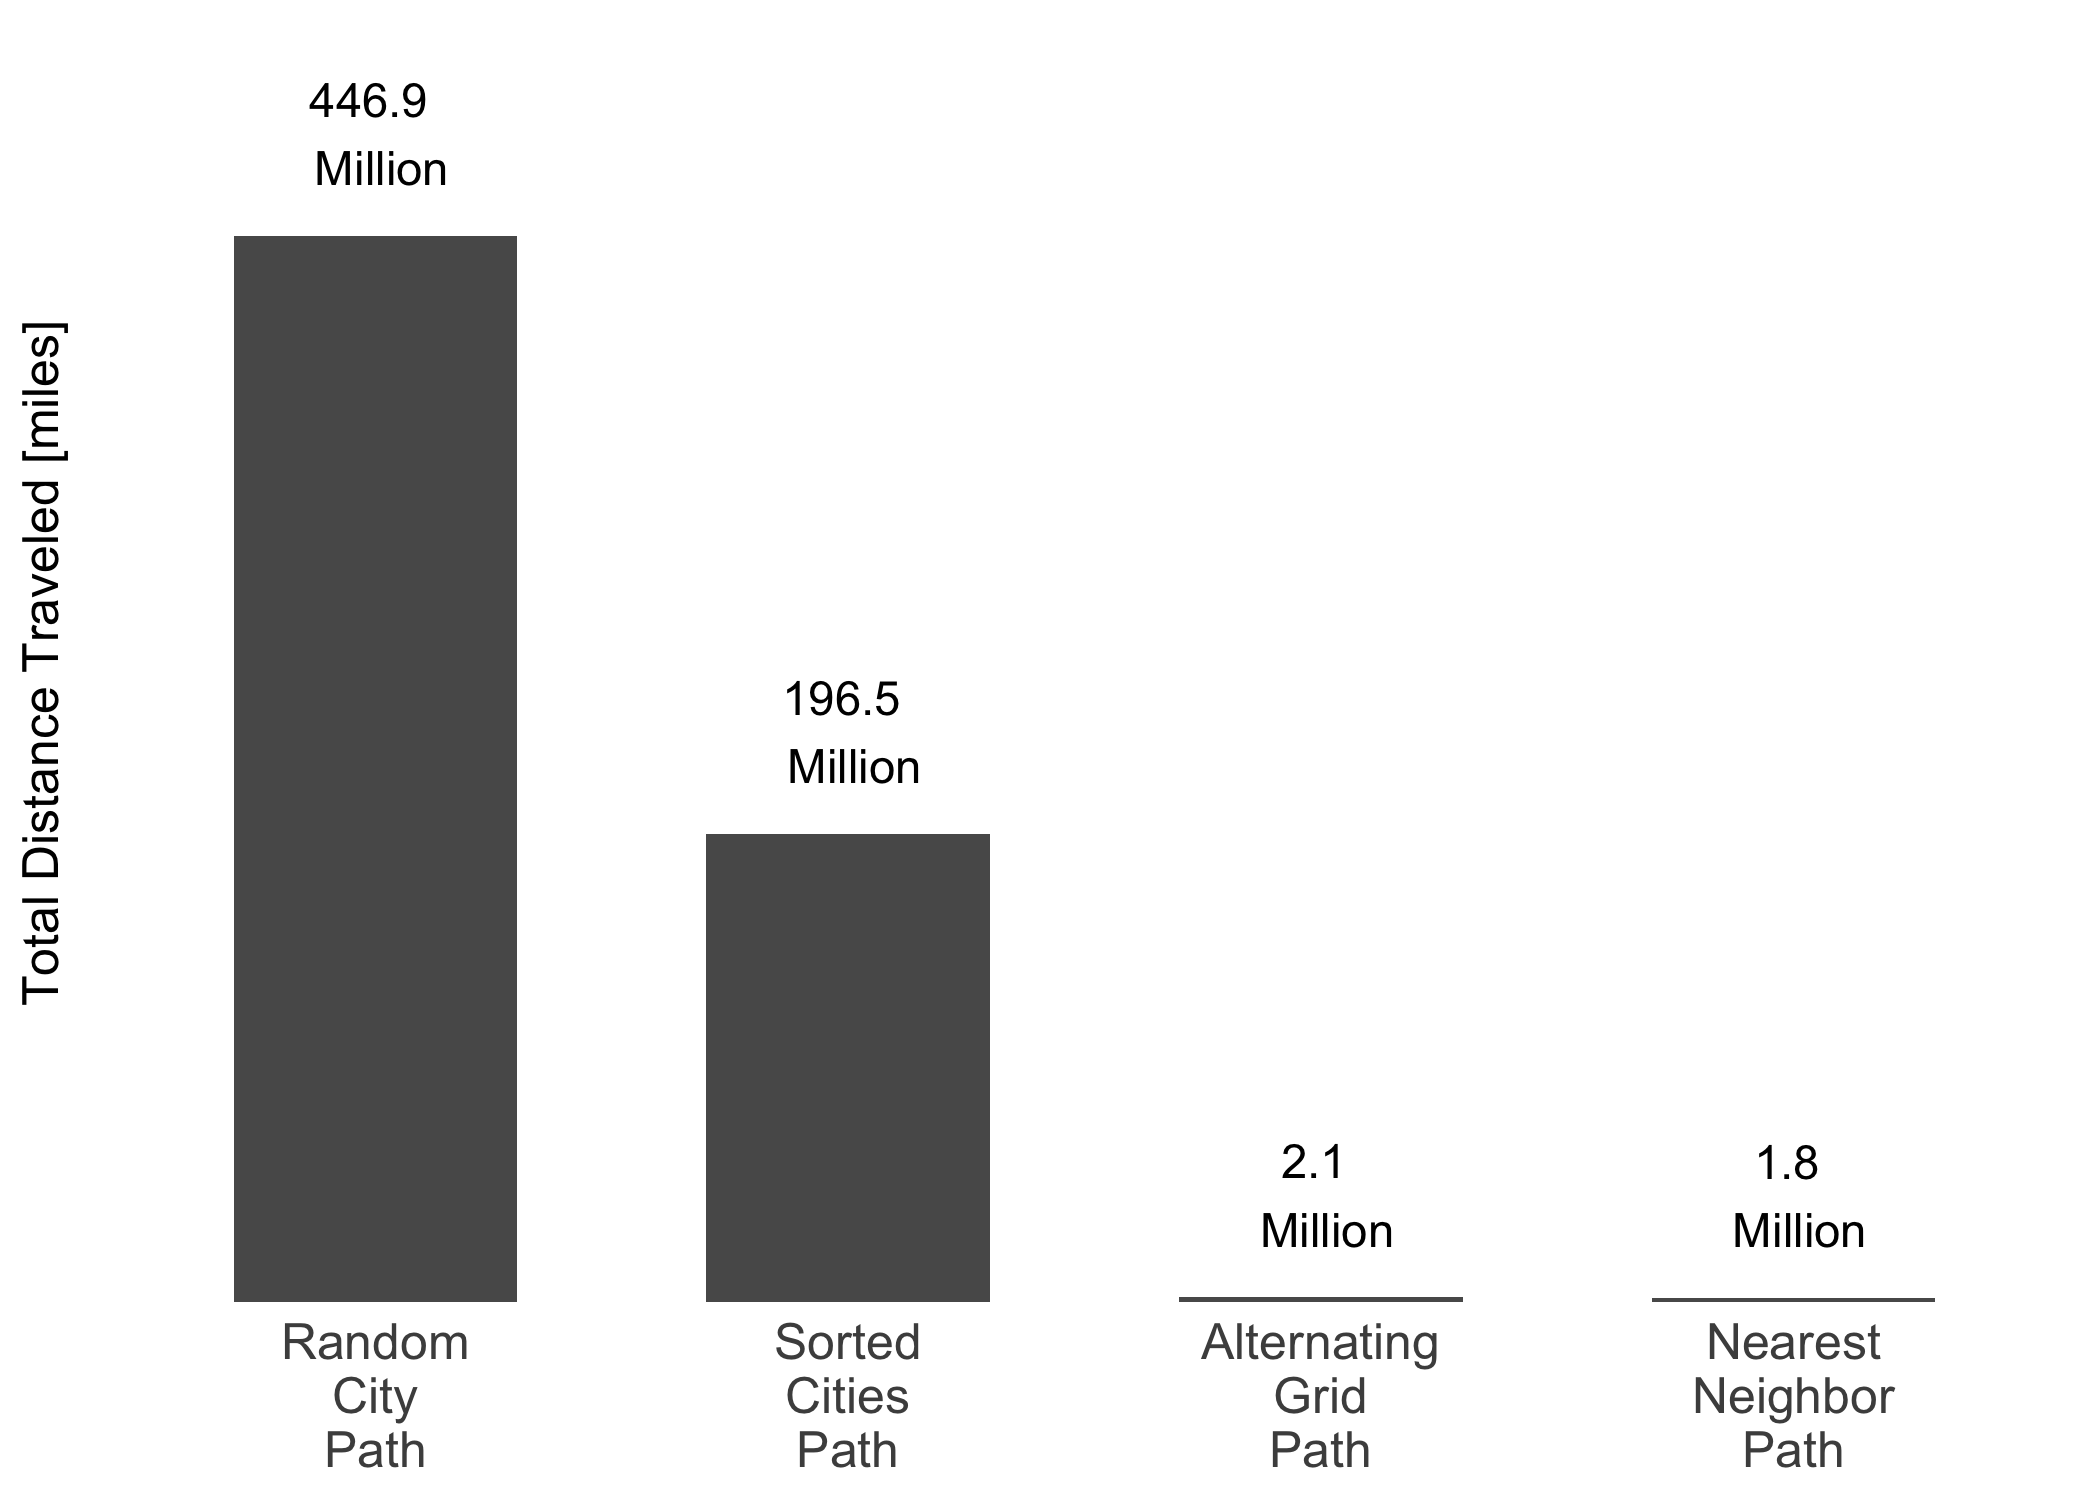
In conclusion, we explored different solutions to traveling salesman problem using first principles and visualization, and achieved results within 20% of very well optimized techniques.
Seshadri Kolluri
Data Scientist & Hardware Engineer
My research interests include data science, data visualization, machine learning, Gallium Nitride electronics, and semiconductor technology development.